

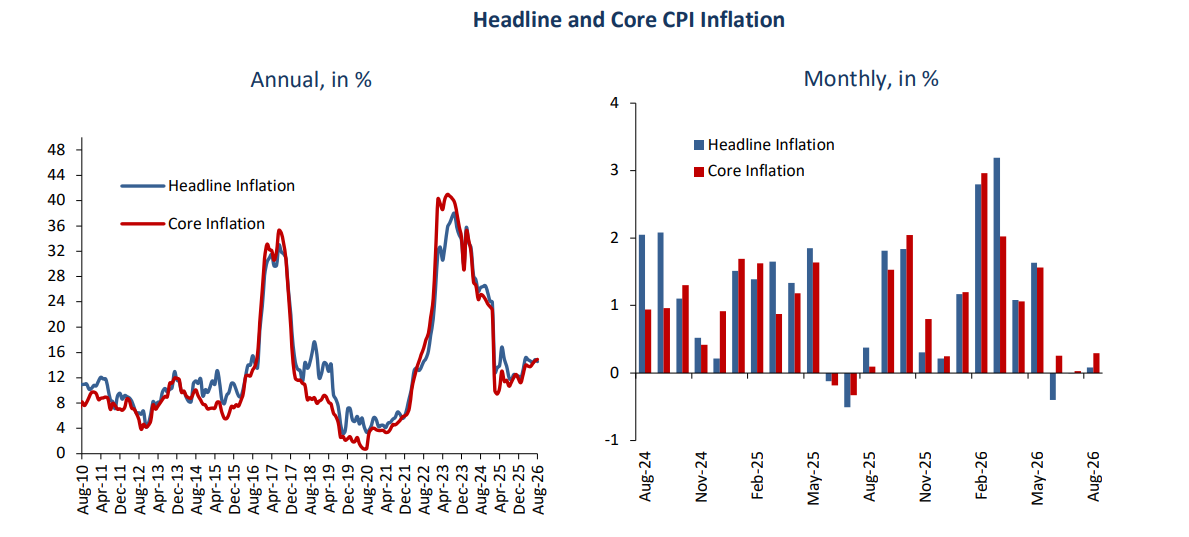
Egypt’s annual urban headline inflation slowed to 14.5% in August 2026, down from 14.9% in July 2026, according to the Central Bank of Egypt (CBE).
The decline was mainly attributed to a softening in annual food inflation, which eased to 6.3% in August 2026 from 8% in July.
Meanwhile, annual non-food inflation edged up to 19.5% in August from 19.1% in July.
Monthly urban headline inflation stood at 0.1% in August 2026, compared with 0.4% in August 2025 and 0% in July 2026, as the decline in food prices partially offset higher non-food prices.
Monthly food inflation recorded -1.1%, as both volatile and core food inflation declined for the third consecutive month, while monthly non-food inflation rose to 0.7%.
Annual core inflation increased to 14.9% in August 2026 from 14.7% in July, reflecting modest price increases in both core food and non-food items.
Monthly core inflation also rose to 0.3% in August, compared with 0.1% in August 2025 and 0% in July 2026. The increase was mainly driven by an uptick in non-food inflation, alongside a marginal decline in core food inflation.
Annual rural headline inflation declined to 10.9% in August 2026 from 11.2% in July. Similarly, annual nationwide headline inflation — a weighted average of the urban and rural CPI baskets — declined to 12.7% in August from 13% in July.
Key Drivers of Monthly Inflation in August 2026
Monthly food inflation declined for the third consecutive month, recording -1.1% and contributing -0.38 percentage points (p.p.) to monthly headline inflation. This was primarily driven by the following:
Volatile food prices recorded -5.5%, contributing -0.35 p.p. to monthly headline inflation. This primarily reflected price declines of 8.2% in fresh vegetable prices and 1.3% in fresh fruit prices, both of which came in below their typical seasonal patterns.
Core food prices recorded -0.1%, contributing -0.03 p.p. to monthly headline inflation. This outcome deviated from its typical seasonal pattern, reflecting falling prices of poultry, and fish and seafood, which declined by 3.2% and 0.3%, respectively.
Meanwhile, egg prices increased by 4.1%.
Monthly non-food inflation registered 0.7%, contributing 0.46 p.p. to monthly headline inflation. This was mainly driven by the following:
Regulated items inflation registered 1%, contributing 0.22 p.p. to monthly headline inflation, on the back of the recent adjustment in electricity prices, except for the first tranche, by 9.2%. The adjustment contributed 0.19 p.p. to monthly headline inflation. In addition, mild increases in tobacco product prices contributed 0.02 p.p.
Services inflation increased by 0.5%, contributing 0.16 p.p. to monthly headline inflation. This primarily reflected higher rents and increased spending at restaurants and cafés.
Retail inflation increased by a mild 0.6%, contributing 0.08 p.p. to monthly headline inflation. This was mainly driven by higher prices for household cleaning products and personal care products, despite stable prices across most other items.
Monthly core inflation recorded 0.3%, reflecting the impact of the aforementioned developments. Specifically, services and retail items contributed 0.22 p.p. and 0.11 p.p. to monthly core inflation, respectively, while core food items contributed -0.04 p.p.
Key Drivers of Annual Inflation in August 2026
Annual food inflation decelerated to 6.3% in August 2026 from 8% in July, contributing 2.39 p.p. to annual headline inflation. This deceleration reflected the following:
Volatile food inflation decelerated sharply to 18.6% in August 2026 from 31.5% in July, contributing 1.09 p.p. to annual headline inflation. This reflected an easing in annual inflation for fresh vegetables and fruits, which recorded 29.1% and 5.9%, respectively.
Core food inflation increased to 4.4% in August from 4.2% in July, contributing 1.30 p.p. to annual headline inflation. The increase was driven by higher prices for red meat, which rose 8.7% year-on-year, and oils and fats, which increased 6.5% year-on-year. This was partially offset by a 15.4% year-on-year decline in egg prices and a 0.5% decline in poultry prices.
Annual non-food inflation increased to 19.5% in August 2026 from 19.1% in July, contributing 12.15 p.p. to annual headline inflation. The increase was driven by the following:
Services inflation increased to 27.8% in August 2026 from 27.3% in July, contributing 7.64 p.p. to annual headline inflation and reflecting steady inflation across most services.
Regulated items inflation increased to 12.3% in August from 11.4% in July, contributing 2.72 p.p. to annual headline inflation. This increase reflected higher household electricity prices.
Retail inflation decreased to 12.1% in August from 12.4% in July, contributing 1.80 p.p. to annual headline inflation. This was mainly driven by easing inflation in household cleaning products, alongside overall stability in retail prices.
Annual core inflation increased to 14.9% in August 2026 from 14.7% in July, reflecting the dynamics of the aforementioned items. In particular, services and retail items contributed 10.60 p.p. and 2.49 p.p. to annual core inflation, respectively, while core food accounted for 1.80 p.p.

