
(AFP File Photo)
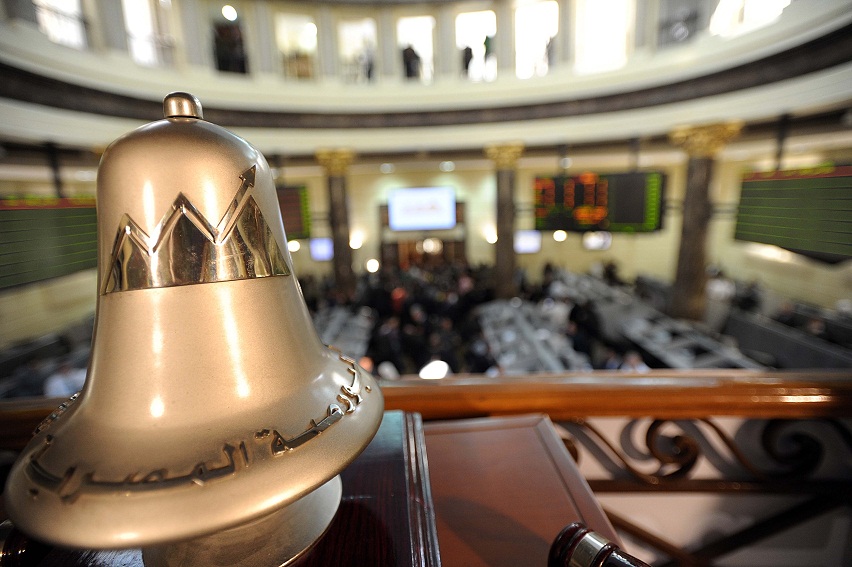
Following several uprisings that occurred in the Arab word in 2011, the region witnessed several political and economic changes. Egypt’s relationship with a number of countries was no exception, as it was affected by those changes. In our special issue, we will highlight the trade relations between Egypt and the Arab League countries and analyse whether or not it was influenced by the political and economical rollercoaster.
During the past four years, the volume of trade between Egypt and the Arab League counties has continued to increase despite the growing conflict in the region. In 2011, trade between Egypt and Arab League counties registered some EGP 67.85bn.
This figure grew in 2012 to EGP 77.15bn then once again in 2013 to reach EGP 90bn. In 2014, the volume of trade was valued at EGP 106.7bn.
According to the trade report issued by the Ministry of Foreign Trade and Industries, the total value of exports to Arab Leagues counties was EGP 50bn, some $8.52bn.
In 2012, the value of exports climbed up to over EGP 54bn, around $8.98bn. This surge continued in 2013 and 2014 were in the exports’ value amounted to EGP 62.9bn and EGP 66.2bn.
The Egyptian imports from the Arab League counties totalled more than EGP 17bn, around $3bn, in 2010. That figure slid up in 2011 and 2012 to total EGP 22.5bn and EGP 27.56bn. A notable increase was witnessed in 2013, where the value totalled some EGP 40.47bn.
Value of imports slightly declined to EGP 37bn in 2014.
Top traded products between Egypt and Arab League countries include building materials, chemicals and fertiliser products and engineering and electronics equipments. On a smaller scale, pharmaceuticals, spinning and weaving products, ready-made garments and furniture are also traded.
 The number one importer of Egyptian building material in since 2011 has been Saudi Arabia. Saudi Arabian imports in 2011 and 2012 totalled EGP 3.9bn and EGP 4.38bn, respectively. The imports decreased in 2013 to reach EGP 3.84bn. In 2014, the lion’s share of imports also went to Saudi although it declined to EGP 2.68bn.
Lebanon was a strong building materials’ importer in 2011 and 2012 but the value of its imports dropped in 2013 and 2014. The United Arab Emirates imports declined during 2012 and 2013 but went back to pre-revolution levels in 2014.
Throughout the past four years, Egypt has imported most of its building materials from Saudi and the UAE. Saudi was the number one exporter to Egypt between 2010 and 2012, but it was topped by the UAE in 2013 and 2014 when its exports to Egypt registered EGP 4.8bn and EGP 4.6bn, respectively.
Exports of building materials totalled EGP 13bn in 2011 then increased to EGP 14.69bn in 2012. That figure decreased to EGP 41bn in 2013 then plummeted to EGP 11bn in 2014. Imports of building materials, however, have shown a significant increase in 2013 and 2014. Average imports of building materials were around 2bn between 2010 and 2012.
Imports of chemicals and fertilisers have also increased significantly between 2011 and 2014, rising from EGP 9bn to EGP 11.33bn. Egyptian exports have fluctuated, however, rising to EGP 6.2bn in 2012 and EGP 7bn in 2013 then settling at EGP 6.6bn in 2014.
For the chemicals and fertilisers market, Saudi Arabia remained the number one importer and exporter throughout the past four years. The United Arab Emirates was the second importer to Egypt.
Engineering and electronics equipments’ imports from Arab League countries have not surpassed EGP 3.6bn in the past four years.
Exports, on the other hand, climbed during those years from EGP 8bn to EGP 13.4bn. Egypt mainly exported to Saudi Arabia and the UAE.
 Turkey
Although it is not in the Arab League, the trade relationship between Egypt and Turkey was strong until political tension began after the ousting of president Mohamed Morsi in 2013.
Exports and imports had continued to increase untill 2013. Exports climbed from EGP 4.6bn in 2010 to EGP 7bn in 2011. In 2012, exports totalled EGP 7.6bn while it reached EGP 10.3bn in 2013. Exports notably plummeted in 2014 to register EGP 6.9bn.
The same case applied to imports from Turkey. In 2010, imports totalled EGP 9.65 then climbed to EGP 10.3bn in 2011. The maximum increase, however, occurred in 2013 when imports totalled 14bn only to experience a major drop in 2014, reaching EGP 8bn.
Qatar
Volumes of trade with Qatar are notably lower than trade with the Saudi Arabia or the UAE, even before the rising political tension after the ousting of Mohamed Morsi.
Imports of chemicals and fertilisers from Qatar climbed in 2011 but dropped notably in 2012, 2013 and 2014.
Egypt still, however, exports some of its engineering products to Qatar. In 2014, the volume of products traded amounted to EGP 1.15bn, which is larger than the amount exported in 2011.
 Future plans
In May 2014, the ministry announced that it is planning to launch a new strategy to double exports of non-petroleum Egyptian products over the next four years.
“We have prepared an ambitious strategy to double exports that is not based solely the value it achieves, but rather on the quality of products exported and its ability to reach target markets,” said adviser to the Minister of Industry and Foreign Trade Abla Abdel Latif.
Egypt aims to generate $28bn in non-petroleum exports in 2015. The largest non-petroleum export is expected to be from the building materials sector which aims to gain $6.3bn in 2015 and has achieved $223m in exports in January. The sector is followed by the chemical and fertiliser products sector, and targets $5.6bn in exports during the same period while achieving $220m in January.
The total value of exports for 2014 registered at $22.11bn, allowing the government to achieve 88.4% of its goal, which was $25bn. The government surpassed its set targets in the medical industry sector, agriculture sector and readymade garments sector.