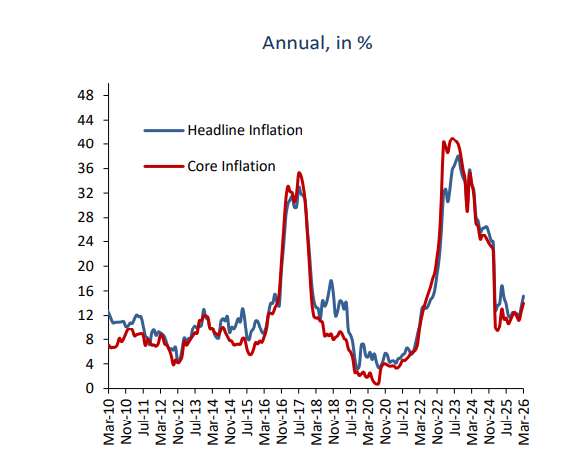
Annual urban headline inflation accelerated to 15.2% in March 2026, up from 13.4% in February, according to the Central Bank of Egypt (CBE). The increase was driven by rising food and non-food inflation, with food inflation climbing to 5.8% from 4.6%, while non-food inflation rose to 21.5% from 19.3%.
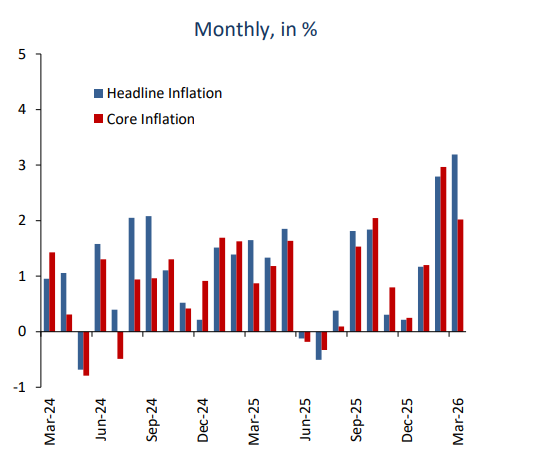
On a monthly basis, urban headline inflation rose to 3.2% in March 2026, compared to 2.8% in February 2026 and 1.6% in March 2025. The uptick was largely attributed to higher food prices, which increased by 4.8% month-on-month.
Annual core inflation also edged higher to 14% in March from 12.7% in February, reflecting stronger contributions from core food and services. However, monthly core inflation moderated to 2%, down from 3% in February, though still above 0.9% recorded in March last year.
Meanwhile, annual rural headline inflation rose to 11.9% in March from 9.7% in February. As a result, nationwide headline inflation—representing the weighted average of urban and rural inflation—accelerated to 13.5%, compared to 11.5% in the previous month.
Key drivers of monthly inflation
Food inflation was the primary driver of monthly price pressures, rising to 4.8% in March from 2.8% in February and contributing 1.74 percentage points (p.p.) to headline inflation.
Volatile food prices surged by 16.8%, driven by a sharp 26.0% increase in fresh vegetable prices. While broadly in line with seasonal patterns, the magnitude of the increase exceeded typical trends. Fresh fruit prices also rose by 1.7%. Together, these items contributed 0.98 p.p. to monthly inflation.
Poultry and egg prices increased by 10.4% and 1.8%, respectively, marking their third consecutive monthly rise and contributing a combined 0.56 p.p.
In contrast, non-food inflation eased slightly to 2.3% in March from 2.8% in February, contributing 1.4 p.p. to headline inflation.
Price increases in regulated items rose by 3.4%, contributing 0.74 p.p., largely reflecting a 14.7% increase in fuel prices following the Ministry of Petroleum’s decision on 10 March to adjust gasoline, diesel, and natural gas prices. This was accompanied by an 11.5% rise in public inland transportation fares and a 21.4% increase in LPG cylinder and household natural gas prices.
Services inflation rose by 2%, driven by higher rents and increased spending at restaurants and cafés, likely reflecting pass-through effects from higher fuel costs. Services contributed 0.59 p.p. to monthly inflation.
Retail inflation recorded a modest increase of 0.8%, contributing 0.12 p.p., supported by higher prices for clothing, footwear, and personal care products.
Monthly core inflation stood at 2% in March, reflecting these developments. Core food contributed 1.05 p.p., while services and retail items added 0.81 p.p. and 0.16 p.p., respectively.
Key drivers of annual inflation
Annual food inflation rose to 5.8% in March from 4.6% in February, contributing 2.35 p.p. to headline inflation.
Core food inflation increased by 4.1%, contributing 1.31 p.p., driven by seasonal increases in poultry, beef, and seafood prices, partially offset by a continued decline in egg prices over the past year.
Volatile food prices rose by 15.9%, contributing 1.04 p.p., mainly due to higher vegetable prices, although this was partially offset by lower fruit prices.
Annual non-food inflation accelerated to 21.5% from 19.3%, contributing 12.81 p.p. to headline inflation. This was primarily due to an unfavourable base effect, despite a moderation in monthly non-food inflation.
Services inflation increased to 24.4%, contributing 6.56 p.p., reflecting earlier rises in rents, transport fares, and spending at restaurants and cafés, in addition to the sustained impact of higher education costs, which picked up in February.
Regulated prices rose to 19% from 15.1%, contributing 3.99 p.p., driven by increases in petroleum products, household natural gas, tobacco, LPG cylinders, and transport fares.
Retail inflation remained broadly stable at 16.1%, compared to 15.9% in February, contributing 2.25 p.p., reflecting relatively steady price movements across most retail categories.
Annual core inflation rose to 14% from 12.7%, mirroring the combined impact of these factors. Services and retail components contributed 9.06 p.p. and 3.11 p.p., respectively, while core food made a more modest contribution of 1.81 p.p.