
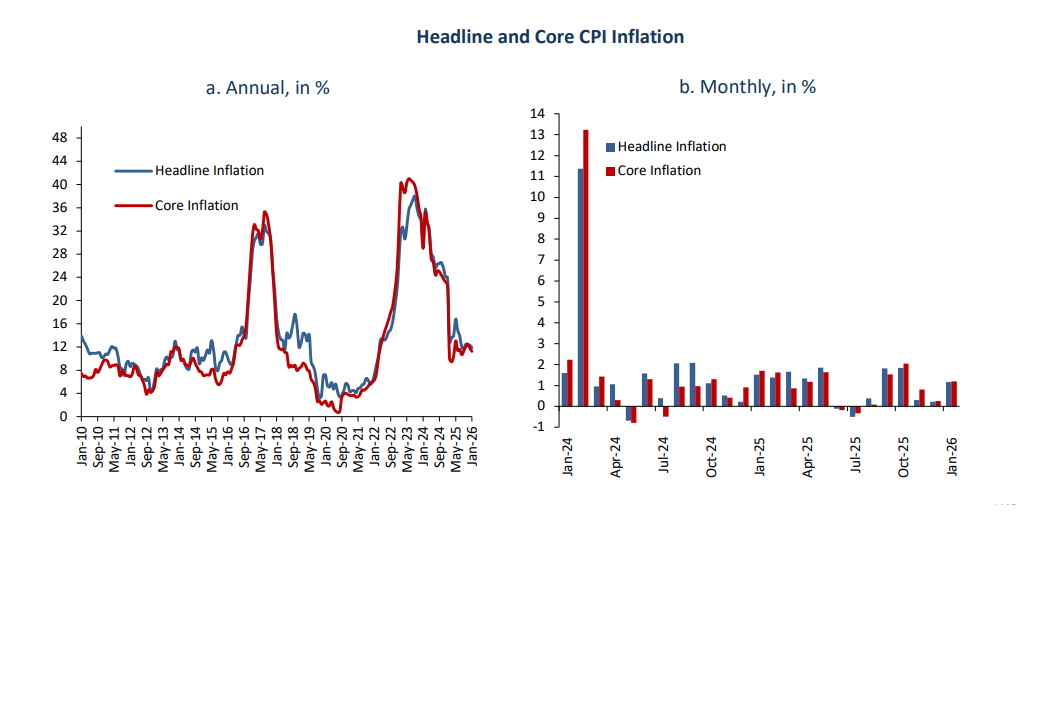
The Central Bank of Egypt (CBE) has outlined the main factors behind the moderation in inflation in January 2026, as annual urban headline inflation fell to 11.9%, down from 12.3% in December 2025.
The decline was primarily driven by a drop in annual non-food inflation to 18.6% – its lowest reading since October 2023 – which outweighed a temporary increase in annual food inflation to 1.9% in January, compared with 1.5% a month earlier.
On a monthly basis, urban headline inflation recorded 1.2% in January 2026, rising from 0.2% in December 2025 but remaining below the 1.5% registered in January 2025. The uptick was largely attributed to higher food prices, consistent with the typical seasonal increase ahead of Ramadan. In contrast, non-food inflation softened during the month, reflecting broad-based stability across most non-food categories.
Annual core inflation edged down to 11.2% in January from 11.8% in December, supported by relatively lower contributions from retail and services. Monthly core inflation stood at 1.2%, compared with 0.2% in December and 1.7% in January 2025.
At the rural level, annual headline inflation remained broadly stable at 8.4% in January 2026, compared with 8.3% in December. Consequently, annual nationwide headline inflation – the average of urban and rural rates – declined slightly to 10.1%, from 10.3% in the previous month.
Regarding monthly developments, food inflation accelerated to 2.3% in January, up from -0.7% in December 2025 and 1.8% in January 2025, contributing 0.82% to monthly headline inflation. This was mainly driven by a 3.7% increase in volatile food prices, as fresh vegetable prices rose by 8.4% while fresh fruit prices declined by 2.8%, in line with seasonal pre-Ramadan patterns. Poultry prices also surged by 11.6%, reversing declines recorded during the fourth quarter of 2025, while egg prices rose by 1.4%. Together, poultry and eggs made a significant contribution to the monthly headline figure.
Monthly non-food inflation eased to 0.5%, down from 0.8% in December and 1.3% in January last year, contributing 0.35% to monthly headline inflation. Services inflation rose by 0.7%, reflecting slight increases in rents as well as restaurant and café prices. Regulated prices increased by 0.4%, mainly due to a 1.3% rise in tobacco prices and a modest 0.8% increase in LPG prices. Retail prices also rose by 0.4%, driven by higher prices for clothing and footwear, personal care products and jewellery.
Monthly core inflation reached 1.2% in January, reflecting the combined impact of these movements. Core food contributed 0.85% to monthly core inflation, while services and retail items accounted for 0.26 and 0.09%, respectively.
On an annual basis, food inflation increased to 1.9% in January from 1.5% in December, contributing 0.77% to annual headline inflation. Volatile food prices rose by 7.5%, contributing 0.46%, amid fluctuations in fresh fruit and vegetable prices throughout the year. Core food inflation remained stable at 1%, contributing 0.31%, reflecting general stability across most food items and moderate increases in seafood, dairy and beef prices. This was partially offset by continued declines in poultry and egg prices since the second half of 2025.
Annual non-food inflation fell to 18.6% from 19.5% in December, contributing 11.12% to annual headline inflation. Retail inflation decelerated to 16% from 18.5%, reflecting broad price stability relative to last year alongside the residual impact of earlier increases in clothing and footwear, medical products, and engine oils and lubricants. Regulated inflation slowed to 15.4% from 16.2%, reflecting the lingering impact of previous fiscal consolidation measures affecting tobacco, LPG cylinders and inland transportation. Services inflation remained stable at 20.8%, indicating relative stability across most service categories despite the continued effect of earlier increases in rents, restaurants and cafés, and transport.
Annual core inflation declined slightly to 11.2% in January from 11.8% in December, reflecting these overall dynamics. Services and retail items accounted for the bulk of annual core inflation, contributing 7.72 and 3.09% respectively, while core food made a modest contribution of 0.43%.

